What is Descriptive Statistics?
Descriptive Statistics is a method of organizing, summarizing, and presenting data in a convenient and informative way.
The actual method used depends on what information we would like to extract.

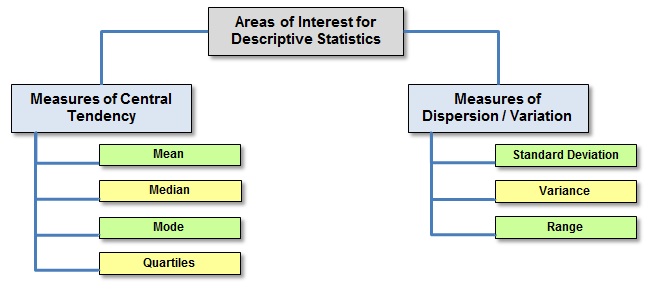
Areas of Interest for Descriptive Statistics
MEASURES OF CENTRAL TENDENCY
MEAN (Arithmetic Average):
Mean is the arithmetic average computed by summing all the values in the dataset and dividing the sum by the number of data values.
For a finite set of dataset with measurement values X1, X2, …., Xn (a set of n numbers), it is defined by the formula:

Mean Formula
The sample mean is represented by x-bar.
The population mean is represented by Greek letter µ.
For a given data set: 12, 14, 11, 12, 12, 12, 15, 17, 22, 15, 12
Sum of data points = (12+14+11+12+12+12+15+17+22+15+12) = 154
Number of data points = (take a total count of observations) = 11
Mean = (Divide sum of data points into total number of data points) = 154/11 = 14
MEDIAN:
The middle number in the data set (n/2), when arranged in ascending order (small to large). If there are odd numbers of observations then median is the (n+1)/2th ordered value. If there are even numbers of observations then median is average of the two middle values.
For a given data set: 12, 14, 11, 12, 12, 12, 15, 17, 22, 15, 12
Ascending Order: 11, 12, 12, 12, 12, 12, 14, 15, 15, 17, 22
Thus, the middle number in the data set
Median = 12
MODE:
Mode is the data point having the highest frequency (maximum occurrences).
For a given data set: 12, 14, 11, 12, 12, 12, 15, 17, 22, 15, 12
Maximum occurring data point,
Mode = 12
QUARTILES:
A quartile is any of the three values which divide the sorted data set into four equal parts, so that each part represents one fourth of the sampled population.
- First quartile (designated Q1) = lower quartile = cuts off lowest 25% of data = 25th percentile
- Second quartile (designated Q2) = median = cuts data set in half = 50th percentile
- Third quartile (designated Q3) = upper quartile = cuts off highest 25% of data, or lowest 75% = 75th percentile
- The difference between the upper and lower quartiles is called the interquartile range.
MEASURES OF CENTRAL DISPERSION/VARIATION
STANDARD DEVIATION:
It can be interpreted as the average distance of the individual observations from the mean. Standard deviation of the population is represented as "σ". Standard deviation of the sample is represented as "s".

Standard Deviation Formula
In the above formula,
Sx stands for standard deviation of the sample.
xi is the value of each variable in the data set.
x bar represents the mean.
n is the total sample size.
And Σ stands for summation i.e. it says that we need to take the sum of “xi – x bar” for all values of x.
VARIANCE:
Variance is defined as the square of standard deviation. Variance of the population is represented as σ times σ. Variance for the sample is represented as "s times s".

Variance Formula
In the above formula,
Sx stands for standard deviation of the sample.
xi is the value of each variable in the data set.
x bar represents the mean.
n is the total sample size.
And Σ stands for summation i.e. it says that we need to take the sum of “xi – x bar” for all values of x.
RANGE:
Range is defined as the difference between largest value in a data set and the smallest value in a data set.

Range Formula
ValueMax stands for the highest (maximum) value in the data set and ValueMin stands for the lowest (minimum) value in the data set.
In a given data-set like 12, 13, 11, 12, 12
Range: 13 – 11 = 2
Mean: (12+13+11+12+12) / 5 = 12
Variance: Sum of [(X – mean) times (X – mean)] / (n – 1) = [0+1+1+0+0] / (5 – 1) = 2 / 4 = 0.50
Standard Deviation: Square Root of 0.50 = 0.7071
 SIXSIGMA INSTITUTE™


