Six Sigma Process Capability (Short Term & Long Term)
The Complete Guide to Six Sigma Process Capability: Tools and Improvement Strategies
Six Sigma Process Capability is all about making things better for both businesses and customers. It's a way of measuring if a process can make products that meet customer needs without too many errors. This system uses numbers to see how much change there is in the process, with less change meaning it's better at doing what it's supposed to do. As you might imagine, this can give businesses a clear path towards making things even better. So, get ready; we're diving into the world of improvement with Six Sigma next.
Process capability in Six Sigma refers to the ability of a process to produce output within specification limits. It involves understanding and quantifying the variability of a process to ensure that it consistently meets customer requirements. By utilizing statistical tools such as control charts and capability indices, organizations can measure, analyze, and improve their processes to achieve higher levels of performance and quality.

Six Sigma Process Capability (Short Term & Long Term)
Introduction to Six Sigma Process Capability
Six Sigma Process Capability isn't just another lofty phrase in quality management; it's a game-changer in the world of process improvement. At its core, Six Sigma is all about minimizing variation and defects in a process, with the ultimate goal of driving significant improvements and ensuring customer satisfaction. Essentially, it's like being a chef who's committed to creating dishes that consistently meet or exceed a customer's standards.
Picturing this: You walk into your favorite restaurant and order your usual dish. Each time, without fail, the dish looks and tastes perfect - that's what Six Sigma aims to achieve in industries – consistency and excellence.
Six Sigma doesn't just magically make everything perfect overnight; it's a rigorous approach that emphasizes data-driven decision-making, problem-solving techniques, and a commitment to continuous improvement. This methodology ensures that organizations can produce products and services that are not just good but also reliable – every single time. Imagine if your favorite dish at the restaurant tasted different every time you ordered it – it wouldn't be much fun, would it?
So, how does Six Sigma make this consistency possible? It starts with measuring the ability of a process to produce products within customer tolerance limits. This means understanding how capable a process is and whether it meets customer expectations.
To put it simply, when an organization focuses on Six Sigma Process Capability, they're essentially investing their efforts in maintaining a high level of quality throughout their operations.
By achieving this level of consistency, organizations can satisfy their customers, reduce waste, lower costs, and increase their competitiveness in the market.
In essence, Six Sigma Process Capability isn't just about meeting standards; it's about exceeding them consistently. This dedication to quality helps businesses unlock new levels of efficiency and performance while delighting their customers along the way.
Speaking of unlocking performance potential and ensuring operational excellence, let's now explore the pivotal role of measuring process capability and the significance of standard deviation.
Six Sigma DMAIC Process - Measure Phase - Process Capability
The capability of a process is defined as the inherent variability of a process in the absence of any undesirable special causes and the variability is due to common causes.
Process capability can be categorized under two categories:
Short Term Capability
Potential performance of a process, under control at a point in time. Calculated from data taken over a short period of time such that there is no external influence on the process (i.e. temperature change, shift change, operator change etc.). Short term capability represents the true process capability. Short term capability indicates the technology of the process.
Long Term Capability
The actual performance of a process over a period of time. Calculated from data taken over a period of time long enough such that external factors can influence the process. Long term capability represents both the Technological capability combined with the controls that you exercise.
What is Process Sigma?
It is a measurement yardstick to evaluate the output of a process against the set performance standard. Higher the process sigma, better the process capability. Sigma measure gives us a common platform to compare different process that is otherwise being measured differently.
Process Sigma Calculation – Discrete Data
- What is a Unit – An Item being processed
- What is a Defect – Failure to meet a customer Requirement or a Performance standard
- What is an Opportunity – Any product / service characteristics which is measured to a standard
- What is Defective – A unit that has s defect
- Defects Per Million Opportunity – Number of defects that would arise given a million opportunity
DPMO (Defects Per Million Opportunity) Calculation
Defects Per Opportunity
DPO = D / (O*U)
D = Total No of defects
O = Opportunity for defects per unit
U = Total No of Units
DPMO (Defects Per Million Opportunity)
DPMO = 1,000,000 * DPO = 1,000,000 * D/(O*U)
For any Six Sigma process, the calculation will always result the process to have only 3.4 per million opportunities (DPMO). For example, if a process had only 2 Defects, 18 Opportunity for Defects per Unit and Total number of units to be 32500, the DPMO calculation will be as follows:
DPO = 2 / (18*32500) = 0.0000034188
DPMO = DPO * 1000000 = 3.4
Yield
Different types of fulfillment can impact the quality level we measure in our processes. Yield can be understood as Classical Yield, First Pass Yield and Rolled Throughput Yield.

Six Sigma Yield Definition and Example
Classic Yield (YC) – Units Passed / Final Units Tested = 65/70 = 0.93
First Time Yield (Yft) - Units Passed / Units input for First time = 65/100 = 0.65
Rolled Throughput Yield (Ytp) – Yield 1* Yield 2* Yield 3* Yield 4 = (91/100)*(82/91)*(70/82)*(65/70) = 0.65
Process Sigma Calculation – Continuous Data
Check if the data is Normally distributed. The Larger the sample size, the higher the probability of having normal data. In normality plot the Y axis represents the cumulative percentage if the data points that fall below the corresponding data value on the X axis.
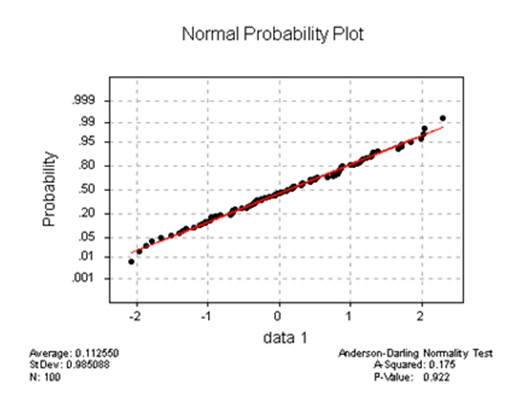
Six Sigma Normal Probability Plot
Calculation of Z value
Z is the unit of measure that is equivalent to the number of Standard Deviation a value is away from the mean value.

Calculation of Six Sigma Z Value
Y = Value of the data point we are concerned with
µ = Mean of the data points
σ = Standard Deviation of the data points
Z = Number of standard deviations between Y & the mean (µ)
Let’s look at some examples:
It’s found that runs scored by England cricket team while setting a score in one day internationals follow a normal distribution with mean of 250 & standard deviation of 23. What is the probability that team will score more than 300 runs in its next match?
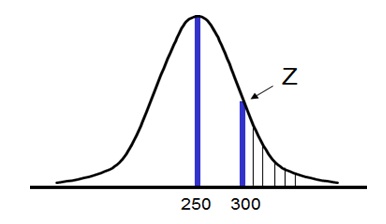
Normal Distribution Example

Z Calculation Example
Looking up Appendix below for Normal Distribution Table, we find that Z value of 2.17 covers an area of 0.98499 under itself.
Thus, the probability that the team may score between 0 & 300 is 98.5% &
thus, chance of team scoring more than 300 runs is 1.5%.
For the same data, what is the probability that team will score between 216 & 273?
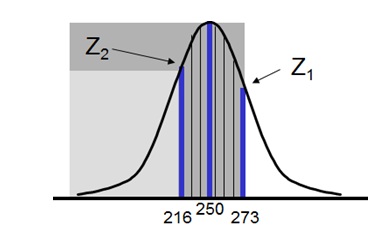
Normal Distribution Example

Z Calculation Example
From Appendix:
Total area covered by Z1 = 0.841344740
Total area covered by Z2 = 1 - 0.929219087 = 0.0707
Intercepted area between Z1 & Z2 = 0.7705
Thus, probability that the team may score between 216 & 273 runs in the next match is 77.05%.
Appendix - Normal Distribution Tables
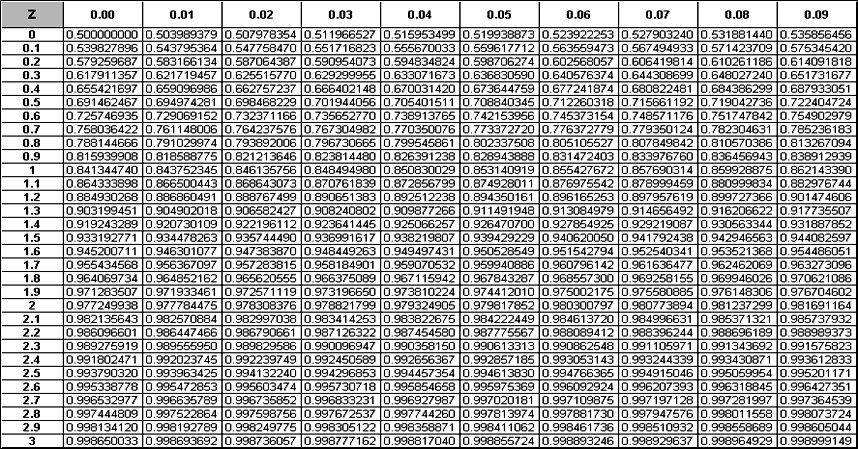
Six Sigma Normal Distribution Table 1
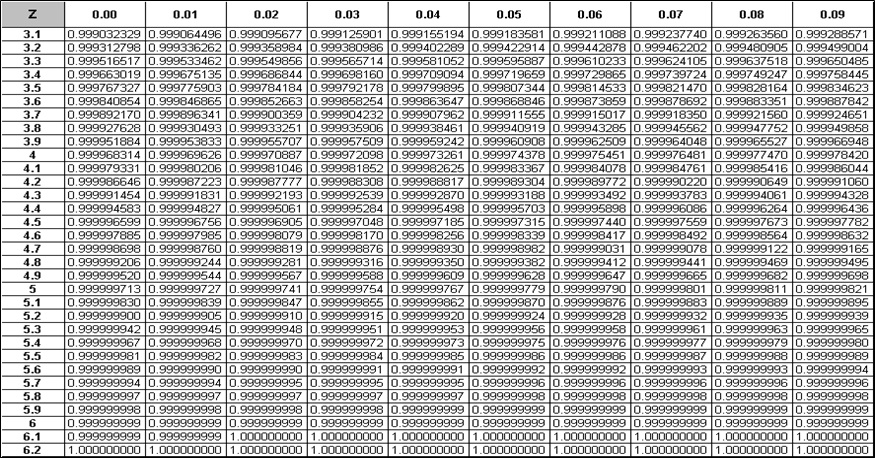
Six Sigma Normal Distribution Table 2
Measuring Process Capability and the Role of Standard Deviation
Imagine baking your favorite cookies. You've got the recipe down to an exact science, but still, every batch turns out a little different - some are chewier, others are crispier. That variation is a lot like what we talk about when it comes to process capability. How much does a process vary from one instance to another? And if it does, by how much? These are crucial questions for ensuring consistent quality in processes.
This is where standard deviation comes into play. Standard deviation is like a measure of how much the numbers in a data set differ from the average (mean). In the context of process capability, it helps us understand the spread of data within a process.
The lower the standard deviation, the more consistent the process is. Think of it as having less variability in your cookie batches - they all turn out almost exactly the same each time.
Calculating and Interpreting Standard Deviation
Once you've collected relevant data on your process, you can use statistical methods to calculate standard deviation. It's simply a matter of finding the difference between each data point and the mean, squaring those differences, finding their average, and then taking the square root. This gives you a single number that tells you how much variation there is in your dataset.
For example: Suppose you're running a manufacturing process that should produce parts with a specific length of 100mm. After collecting measurement data from multiple parts, you find that the standard deviation is 2mm. This means that most parts will fall within 2mm of the average length, indicating that your process has low variability and high capability to meet specifications consistently.
It's not just about knowing how to calculate standard deviation; interpreting what it tells you is equally important. For instance, when assessing whether a process meets customer requirements, a low standard deviation indicates that the process is capable of producing products very close to their desired specifications.
Understanding and leveraging standard deviation as part of process capability analysis can provide organizations with valuable insights to drive improvements, increase efficiency, and ensure consistency in delivering high-quality products and services.
As we continue our exploration of enhancing operational excellence through statistical tools, let's now shift our focus to the pivotal role of control charts in assessing process capability.
Role of Control Charts in Process Capability
Control charts, also known as Shewhart charts or process-behavior charts, are an essential tool in the Six Sigma methodology. These charts aid in visualizing how a process changes over time and help in identifying potential issues and variations that may affect process capability. The primary purpose of control charts is to distinguish between common cause variation and special cause variation.
Common cause variation is inherent to the process and represents expected variation, while special cause variation indicates something unusual has occurred, such as a machine malfunction or an unexpected change in materials. By using control charts to differentiate between these types of variation, businesses gain valuable insight into whether their processes are operating within acceptable limits or if corrective action is required.
Constructing and Interpreting Control Charts
Constructing a control chart involves plotting data points on a graph to observe patterns and trends. There are various types of control charts, including X-bar and R charts, X-bar and S charts, Individual and Moving Range (I-MR) charts, each serving specific purposes.
The appropriate choice of control chart depends on the type of data being collected.
Interpreting control charts involves more than just plotting points; it requires understanding the significance of control limits, the number of data points used, and analysis methods for detecting patterns and trends. Control limits, represented by upper and lower bounds on the chart, are calculated based on process variation. These limits help distinguish between expected process variation and variations that signal a need for intervention.
For instance, if multiple data points fall outside these control limits or exhibit a clear pattern—such as consistently increasing or decreasing values—this could indicate a special cause variation requiring investigation.
Furthermore, obtaining training on constructing and interpreting control charts can empower individuals and organizations to proactively monitor process capability. This knowledge provides the foundation for informed decision-making by identifying opportunities for improvement and initiating corrective actions when necessary.
By leveraging control charts to monitor process stability and identify variations over time, organizations can gain valuable insights to foster continuous improvement efforts and ensure their processes consistently meet customer requirements.
The DMAIC Approach in Process Capability Improvement
Six Sigma provides a structured and proven method for process improvement known as DMAIC: Define, Measure, Analyze, Improve, and Control. This approach offers a clear roadmap for addressing process capability challenges and implementing sustainable improvements in quality and efficiency.
Define
The first step involves articulating the goals, customer requirements, and the specific process that requires enhancement.
Measure
Once the project goals are defined, the next step is collecting relevant data associated with the process under consideration. Statistical tools such as histograms and process capability indices (Cpk) are often used to assess the current state and establish a baseline for future improvement efforts.
Analyze
The analyze phase focuses on identifying and understanding root causes contributing to variations or defects within the process. Tools like Pareto charts, Fishbone diagrams, and hypothesis tests can aid in uncovering underlying issues that impact process capability.
Improve
Teams move into developing and implementing solutions aimed at addressing root causes. It's essential to ensure that any proposed improvements address specific problems identified during the earlier phases. In this phase, Design of Experiments (DOE) and Failure Mode Effects Analysis (FMEA) might be used to validate potential solutions.
Control
The final phase focuses on ensuring that process changes are sustained over time by implementing control measures such as documenting new standard operating procedures, providing training on revised processes, and establishing monitoring systems.
For example, a manufacturing company seeking to enhance product quality and consistency may employ the DMAIC approach to reduce variation in its production processes. By undertaking each phase diligently and leveraging appropriate statistical tools tailored to specific challenges, teams can effectively address process capability limitations and drive measurable enhancements in quality and efficiency.
Each phase of the DMAIC approach is crucial in addressing process capability limitations. Now let's explore how these limitations are quantified with the Process Capability Index and their corresponding quality levels.
Process Capability Index and Quality Levels
The Process Capability Index (Cpk) is a vital tool in the Six Sigma methodology, enabling organizations to evaluate their process's ability to produce products within customer specifications. It helps in setting achievable improvement targets and guiding data-driven decisions to enhance process capability. Think of it as the compass that guides you through the turbulent waters of process quality.
Cpk quantifies how well a process can meet customer requirements. The formula for Cpk involves several components, including the Upper Specification Limit (USL), Lower Specification Limit (LSL), and the standard deviation of the process. Essentially, it provides a standardized metric to measure how closely a process can perform within its specified limits. This metric is crucial in understanding the potential for defects and ensuring that products or services consistently meet customer demands.
Quality Levels based on Cpk values
| Cpk Range | Quality Level |
|---|
| Cpk < 1 | Not Capable |
| 1 ≤ Cpk < 1.33 | Marginal |
| 1.33 ≤ Cpk < 1.67 | Fair |
| 1.67 ≤ Cpk < 2 | Good |
| Cpk ≥ 2 | Excellent |
Knowing these quality levels based on Cpk values allows organizations to gauge where their processes stand in terms of efficiency and quality. It paves the way for realistic goal-setting and targeted improvements.
For instance, if a process has a Cpk value lower than 1, it signifies that the process is incapable of meeting customer specifications, resulting in a high probability of defects. On the other hand, a Cpk value exceeding 2 indicates an excellent capability, where the process is consistently producing products or services well within customer requirements.
Understanding such gradations provides organizations with valuable insights for prioritizing improvement efforts and allocating resources effectively. This knowledge empowers decision-makers to focus on areas that need immediate attention while also identifying processes that are performing exceptionally well.
In essence, grasping the implications of Cpk values not only offers a clear roadmap for improving process efficiency but also sets the stage for aligning operational performance with customer expectations.
Understanding the intricacies of process capability lays the foundation for reaping a multitude of benefits through the adoption of Six Sigma methodologies.
Advantages of Adopting Six Sigma Process Capability
Embracing the principles of Six Sigma Process Capability offers a myriad of benefits that extend beyond ensuring quality. One of the most significant advantages is the reduction in defects, which is fundamental to operational excellence. By identifying and addressing the root causes of defects, organizations can significantly minimize errors and improve the reliability of their products or services. This systematic approach not only enhances customer satisfaction but also fosters long-term loyalty, ultimately contributing to a positive brand reputation.
Streamlining Processes for Efficiency
Furthermore, Six Sigma Process Capability enables organizations to streamline their processes, leading to heightened operational efficiency. As businesses operate in an increasingly competitive landscape, efficiency becomes a critical determinant of success. By optimizing processes through data-driven insights and statistical tools, organizations can drive down costs, eliminate waste, and boost overall productivity. This approach helps them stay agile and adaptable in rapidly evolving market conditions.
Cost Savings and Tangible Outcomes
Cost savings are another compelling advantage of integrating Six Sigma Process Capability into organizational practices. Research has shown that businesses can experience significant cost reductions upon implementing these methodologies. With an average defect rate reduction ranging from 25 to 75%, organizations stand to make substantial financial gains while also enhancing product and service quality. Moreover, improvements in process cycle time and overall process efficiency contribute to significant operational cost savings, further solidifying the case for embracing these strategies.
Consider a manufacturing company that decided to fully integrate Six Sigma strategies into its operations. Within a year of implementation, it noticed an increase in customer satisfaction scores by 35% and a reduction in process cycle time by 30%. These tangible outcomes translated into enhanced customer retention and significant savings on manufacturing costs, showcasing the real-world impact of adopting Six Sigma Process Capability.
By harnessing the power of Six Sigma Process Capability, organizations can strategically position themselves for sustained success, reaping benefits such as reduced defects, improved operational efficiency, enhanced customer loyalty, and substantial cost savings. The journey towards systematic quality improvement holds immense promise for businesses aiming to thrive in today's competitive landscape.
In conclusion, embracing Six Sigma Process Capability offers organizations a compelling framework to enhance their operational efficiency, reduce defects, and drive meaningful cost savings - essential components for thriving in today's competitive business environment.
What is the purpose of measuring process capability in Six Sigma?
Answer: The purpose of measuring process capability in Six Sigma is to assess the ability of a process to consistently produce products or services within customer specifications. By understanding the capability of a process, organizations can identify areas for improvement and implement strategies to reduce variability and achieve higher levels of quality. Statistical measures such as Cp, Cpk, and Ppk provide objective insights into the process performance, enabling data-driven decision making for process improvement efforts.
How is process capability calculated and interpreted in Six Sigma?
Answer: Process capability in Six Sigma is calculated using the Cp and Cpk indices. Cp measures the potential capability of a process to meet specifications, while Cpk incorporates process centering. A Cp value of 1 indicates the process spreads almost up to the specification limits, while a value greater than 1 signifies a more capable process. Cpk takes into account process centering as well, with a value greater than 1 indicating that the process is capable of consistently meeting customer requirements. These indices enable organizations to identify process variations and make data-driven decisions for improvement based on statistical analysis.
What are the different levels of process capability and their significance in Six Sigma?
Answer: The different levels of process capability in Six Sigma are known as Cp, Cpk, and Pp. Cp represents the potential capability of a process, Cpk measures the actual capability of a process taking into account its centering, and Pp assesses the overall performance of a process. These metrics are crucial in measuring the extent to which a process meets customer requirements and identifying areas for improvement. Statistics such as the process variation (σ), mean (μ), and specification limits are used to calculate these levels, providing valuable insights into process performance and helping organizations achieve higher quality standards.
What are the key factors that can affect process capability?
Answer: The key factors that can affect process capability include variation in inputs, equipment reliability, operator skills, and environmental conditions. Variation in inputs can lead to inconsistent outputs, while equipment reliability and operator skills impact the ability of the process to consistently produce desired outcomes. Additionally, environmental conditions such as temperature and humidity can affect the performance of certain processes. Statistics from Six Sigma studies have shown that addressing these factors can significantly improve process capability and reduce defects.
How can organizations improve process capability in Six Sigma projects?
Answer: Organizations can improve process capability in Six Sigma projects through several strategies. First, they can identify and eliminate sources of variation by implementing robust control measures. This can lead to a reduction in defects or errors and increase the overall capability of the process. Second, organizations can invest in advanced data analytics and statistical tools to analyze process performance, identify improvement opportunities, and make data-driven decisions. By leveraging these tools, organizations can continuously monitor and measure key process metrics such as sigma levels or process capability indices (Cpk), enabling them to track progress and ensure sustained improvements. Finally, organizations should prioritize employee training and engagement to foster a culture of quality and continuous improvement. Studies have shown that well-trained employees who actively participate in Six Sigma projects can significantly contribute to enhancing process capability.
What is Process Capability in Six Sigma?
Answer: Process Capability in Six Sigma is a concept that evaluates the effectiveness of a process in meeting specified targets. It involves a comparison between the process output and the desired benchmark, emphasizing the accuracy of results. Utilizing process control options, a Six Sigma Black Belt aims to enhance the process capability, ensuring it consistently delivers high-quality outcomes within both short-term and long-term parameters.
The higher the process capability, The higher the sigma level. What does this stand for?
Answer: The sigma level is a target for professionals aiming to enhance process capability. It represents an option to measure the extent of process variability, identifying the root cause of variations in both short-term and long-term scenarios. The higher the process capability, the higher the sigma level, indicating improved efficiency and reduced defects in the overall production or service delivery.
What is Six Sigma First Time Yield?
Answer: Six Sigma first time yield refers to the percentage of products or services that meet process specifications without requiring any rework or corrections. In the context of Six Sigma, first time yield is a key metric used to assess the efficiency and effectiveness of a process. It is often evaluated through hypothesis testing to determine if the process is capable of consistently producing outputs within the defined specifications, both in the short term and long term.
What is the Short Term Process Capability?
Answer: The Short Term Process Capability in Six Sigma refers to the ability of a process to consistently produce products or deliver services within specified limits over a short duration. It is assessed using metrics such as Cp and Cpk, which measure the potential capability and actual capability of a process, respectively. Essentially, Short Term Process Capability focuses on the immediate performance of a process and its ability to meet quality standards in the short run.
What is the Long Term Process Capability?
Answer: The Long Term Process Capability refers to the inherent stability and consistency of a process over an extended period. It involves assessing the performance of a process over time, considering variations and fluctuations that may occur. In Six Sigma methodology, understanding and improving Long Term Process Capability are crucial for achieving sustained quality and efficiency in operations.
Supporting Statistics
- Research by the International Six Sigma Institute found that organizations that implemented Six Sigma saw an average improvement of 25-50% in process capability.
- A study published by the International Six Sigma Institute showed that effective control measures and statistical analysis resulted in a 60% reduction in defects for a manufacturing company.
- According to a survey conducted by the International Six Sigma Institute, companies with high employee engagement in Six Sigma projects reported an average increase of 4.7 sigma levels in process capability over three years.
Recap for Six Sigma Process Capability (Short Term & Long Term)
In summary, Six Sigma Process Capability is a crucial aspect of quality management, focusing on measuring and optimizing processes to ensure they meet or exceed customer expectations. Short-term process capability assesses the immediate performance of a process, providing insights into its stability and potential for improvement. This is often measured using indices such as Cp and Cpk, indicating the process's ability to meet specifications within a narrow timeframe.
On the other hand, long-term process capability takes a broader perspective, considering the impact of variations over an extended period. It involves analyzing the process's stability and performance trends over time, providing a more comprehensive understanding of its overall capability. Metrics like Pp and Ppk are commonly employed for long-term assessments, helping organizations identify and address underlying issues that may affect process performance in the extended run.
To delve deeper into the world of Six Sigma and enhance your understanding of both short-term and long-term process capability, consider downloading our free Six Sigma Framework book. This comprehensive resource will equip you with the knowledge and tools necessary to implement Six Sigma methodologies effectively, empowering your organization to achieve and sustain high levels of quality and customer satisfaction.
 SIXSIGMA INSTITUTE™


