Measure Phase in Six Sigma: DMAIC Measurement Systems
The Measure Phase in Six Sigma is an important part of problem-solving. It involves capturing key information about current practices to help inform improvements. Believe it or not, the beauty of this phase lays in the mundane details of facts and figures. The key fact you're missing is that this process doesn't just list out the problems but spots potential improvement areas within them. As we travel further into the labyrinth of data collection, we'll find that it is not just about gathering any data—but accurate, pertinent, and reliable measurements are what illuminate the path towards enhancement. So let's delve in, shall we?
qu
The Measure Phase in Six Sigma aims to gather critical data that provides insights into process performance and variation. It involves identifying key measures, collecting relevant information, and conducting analysis to understand the current state of processes, setting a foundation for subsequent improvement initiatives.
The DMAIC Measurement Systems
The Objective of this section is to identify and understand the components of variation arising out of the measurement system and to be able to use the appropriate tool for analysis depending on the data type.
Measurement System Analysis (MSA) for Data Types
For continuous data type the Gage Repeatability and Reproducibility (R&R) studies are done and we check for:
- % Tolerance
- % Contribution
- Number of Distinct Categories
For discrete data the Discrete Data Analysis (DDA) is done:
- Accuracy
- Repeatability
- Reproducibility
All of the above values are derived out of any statistical software. We will see a few thumb of rules after understanding the Measurement System in more detail.
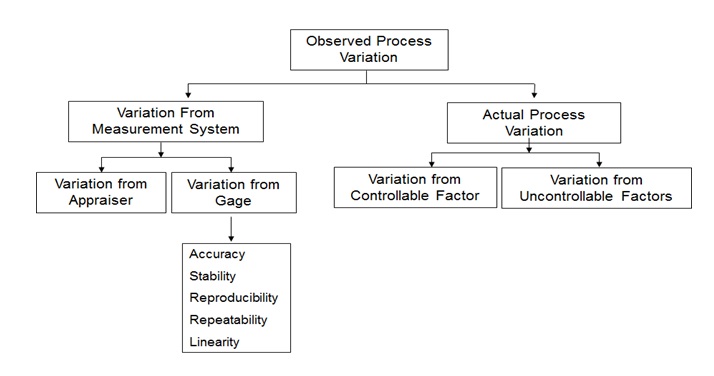
Six Sigma Components of Variation
The variation in process can result due to the Actual Process Variation and the Variation from Measurement System. The Actual Process Variation is resulted because of Controllable Factors and/or Uncontrollable Factors.
Variation from Measurement System is not advisable. This variation is due to Variation from Appraiser (due to the operator – individual who operates the tool/instrument/gate) and Variation from Gage i.e. Variation due to the instrument itself. Variation from gage can be further classified into Accuracy, Stability, Repeatability, Reproducibility and Linearity.
Variation (observed) = Variation (Actual) + Variation (Measurement)
The above equation indicates that the Observed Variation in a process is due to Actual Variation and the variation due to the Measurement System.
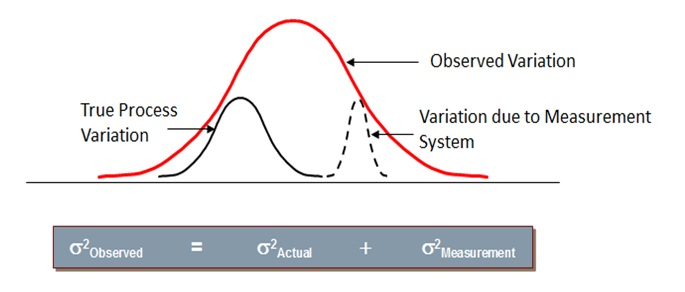
Six Sigma Process Variation
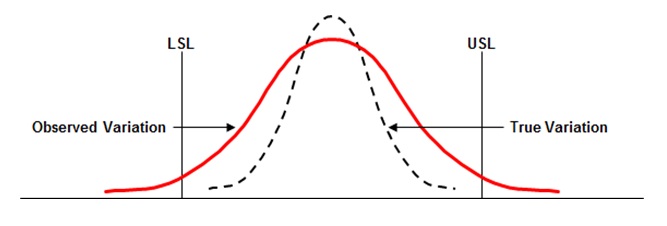
Six Sigma Observed Variation vs True Variation
In the above example, LSL – Lower Specification Limit and USL – Upper Specification Limit.
Measurement System Analysis
Measurement system errors can be due to:
- Accuracy – The difference between the average of observed values and the standard
- Repeatability – Variation in measurement when a person measures the same unit repeatedly with the same measuring gage (or tool)
- Reproducibility - Variation in measurement when two or more persons measure the same unit using the same measuring gage (or tool)
- Stability - Variation in measurement when the same person measures the same unit using the same measuring gage (or tool) over an extended period of time.
- Linearity – The consistency of the measurement across the entire range of the measuring gage.
Acceptable Level of Measurement System Variation (Rules of Thumb)

Six Sigma Gage R&R Thumb Rule – Continuous Data

Six Sigma Attribute R&R Thumb Rule – Discrete Data
Process Variation
Process Variation is generally due to two causes: Common Causes and Special Causes. Common cause is also called as Noise. Variation is inherent in the system. It results in a stable – IN CONTROL – process because the variation is predictable and it is evident in the system. Whereas Special causes are also called as Signals. They are unexpected occurrences due to unforeseen circumstances. It results in an unstable – OUT OF CONTROL – process because the variation is not predictable.
Data Interpretation
Data is interpreted using factors such as Stability, Normality, Shape, Spread and Centering.
Let’s take a look at the first factor – Stability. Run chart is an important tool for understanding data stability. Run charts are simple time ordered plots of process data. On run chart plots one can perform tests for certain patterns in the data to understand data stability and presence of these patterns indicate special causes of variation.
Special cause variation in a run chart can be understood by the following patterns: Same Value Plot, Clustering or Too Few Runs Plot, Mixtures or Too Many Runs Plot, Oscillations Plot, Trends Plot, Shifts Plot.
Run Chart – Same Value Plot
A run chart having seven or more points with same value in a sequence indicates bias in the process.
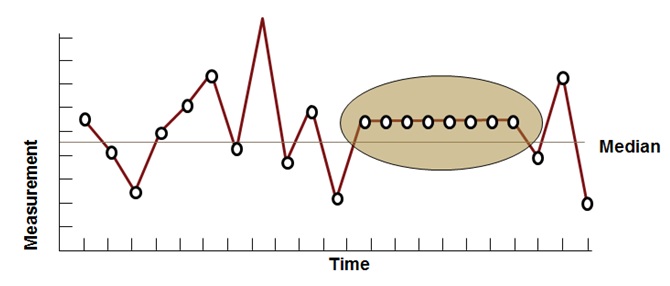
Six Sigma Run Chart – Same Value Plot
Run Chart – Clustering Plot
Such a plot has lot of data points next to each other on one side of the median and the same way on the side of the median over time and indicates a periodic shift in process average due to lot-to-lot or setup variability; Also known as too few runs plot.
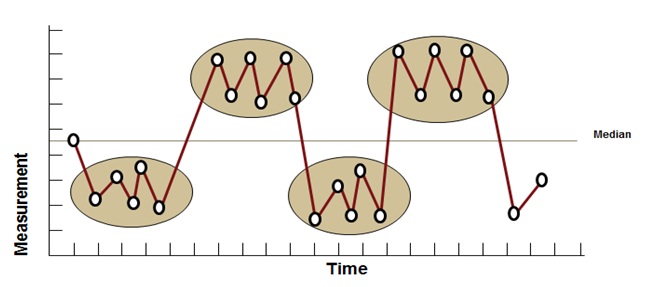
Six Sigma Run Chart – Clustering Plot
Run Chart – Mixtures Plot
Such a plot has and absence of points near the center line with a sequence of fourteen or more points in a row alternating up and down; indicates a bias or systematic sampling from different sources or processes; Also known as cycle or too many runs plot.
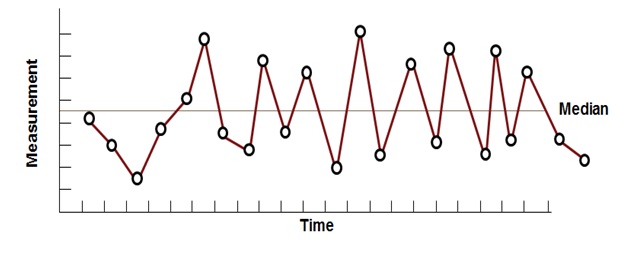
Six Sigma Run Chart – Mixtures Plot
Run Chart – Oscillation Plot
Such a plot, has data points constantly fluctuating up and down rapidly around the median and indicates that the process is not steady or stable.
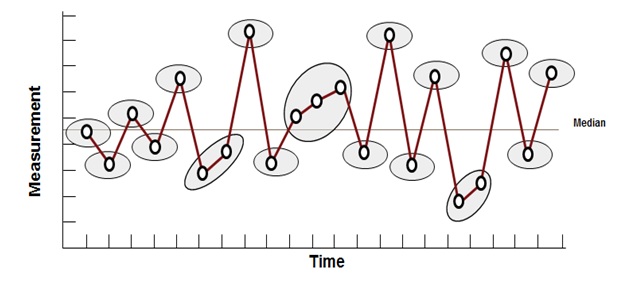
Six Sigma Run Chart – Oscillation Plot
Run Chart – Trend Plot
Such a plot has a sequence of seven or more data points continuously increasing or decreasing and indicates a gradual increase or decrease trend in the data measurement methods.
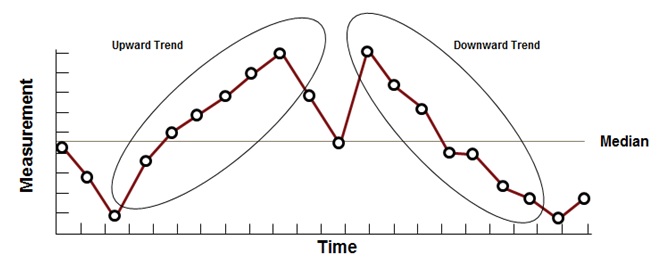
Six Sigma Run Chart – Trend Plot
Run Chart – Shift Plot
Such a plot has a sequence of eight or more points on the same side of the median and indicates a gradual shift in the process.
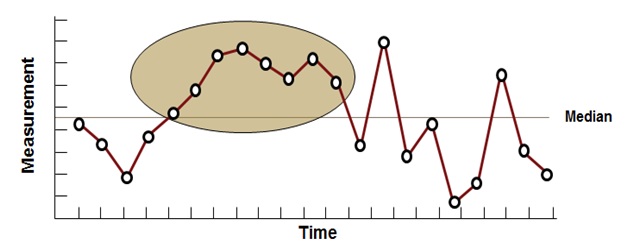
Six Sigma Run Chart – Shift Plot
Introduction to Normal Distribution
Normal Distribution was developed by astronomer Karl Gauss. It is a most prominently used distribution in statistics. Its applicability is to many situations where given the population knowledge, we need to predict the sample behavior. It comes close to fitting the actual frequency distribution of many phenomena such as:
- Human characteristics such as weights, heights & IQ’s
- Physical process outputs such as yields
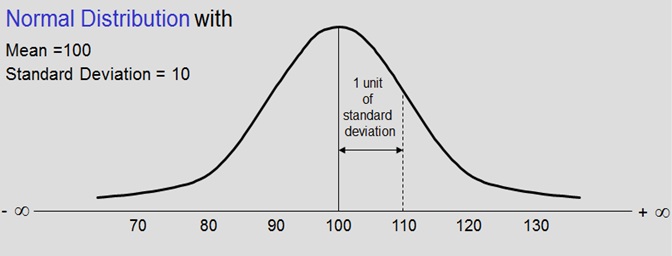
Six Sigma Normal Distribution - 1
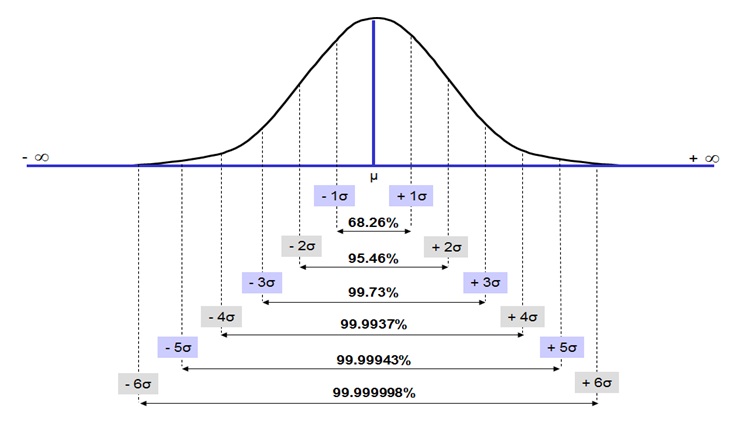
It’s a Probability Distribution, illustrated as N ( µ, σ ) i.e. it is characterized by Mean and Standard Deviation. Simply put, a probability distribution is a theoretical frequency distribution. It has higher frequency of values around the mean & lesser & lesser at values away from mean. It is Continuous & Symmetrical. Its tails are asymptotic to X-axis i.e. the tails will never touch the X-axis. It is Bell shaped and the Total area under the Normal curve = 1.
For the data that does not follow normal distribution, the data will not be bell shaped as above. It could be stretched to the left or right or it can also have multiple peaks or it may show some other pattern. We term such data as non-normal data.
Six Sigma Normal Distribution - 2
As you will observe in the above diagram, a process with 1σ (one sigma), the performance of the process is at 68.26%. As the Sigma value increases (2 σ, 3 σ, 4 σ, etc), the performance of the process also increases (95.46%, 99.73%, 99.9937%, etc). When the process achieves 6 σ level, the performance of the process is as high as 99.999998%.
Now let us look at how we can determine Normality of the data set. Anderson-Darling normality test is performed on the data to understand its normality characteristics. A data is considered to be normal if the P-value is greater than .05, and the hypothesis test states:
- H0 – Data is normal
- Ha – Data is not normal
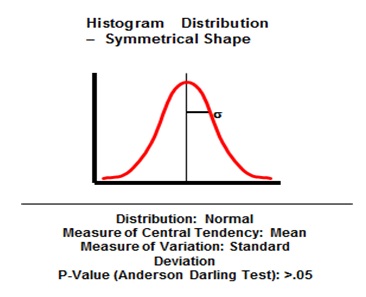
Six Sigma Histogram Distribution Symmetrical Shape
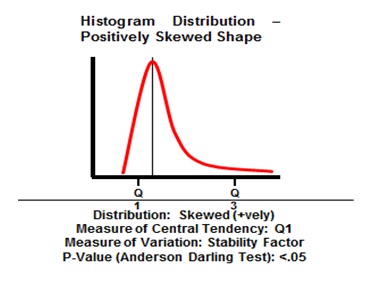
Six Sigma Histogram Distribution Positively Skewed Shape
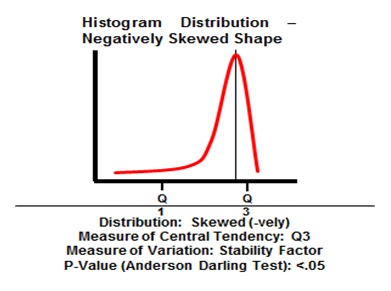
Six Sigma Histogram Distribution Negatively Skewed Shape
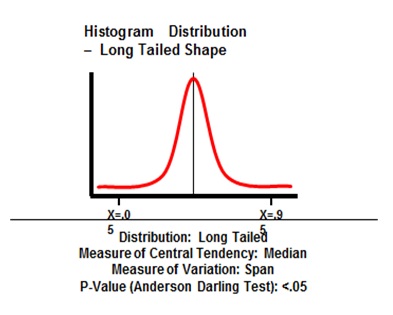
Six Sigma Histogram Distribution Long Tailed Shape
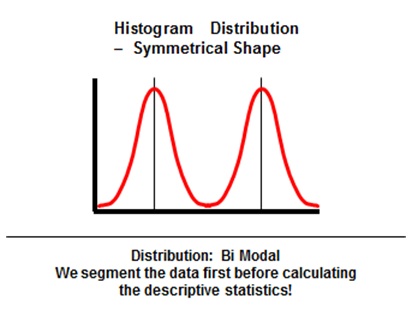
Six Sigma Histogram Distribution Bi-Modal Symmetrical Shape
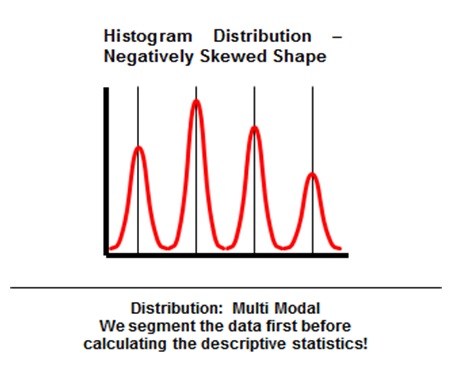
Six Sigma Histogram Distribution Multi-Modal Negatively Skewed Shape
What do I do when data is Non Normal?
When the data is non-normal, we transform the data from non–normal to normal. We can transform the data with the following possibilities:
- Take the Log (any Base) of your raw measurement.
- Raise your individual measurements to a power.
- Use the reciprocal (1/y) of your individual measurements.
When we transform data, we should take following caution:
- When you transform your data, you must also transform your specification limits.
- You will use the transformed data throughout the analysis of your data.
- Use transformation of data the last resort after checking all other alternatives such as more data collection, validating data consistency.
Understanding the Measure Phase in Six Sigma
The Measure phase in Six Sigma is a crucial stage that sets the tone for the entire process improvement initiative. Visualize this phase as a compass, guiding you through your organization's processes with precision. Here, the focus lies in gathering comprehensive information about the current processes involved in a problem. However, it's not just about collecting any information; it's about identifying and defining key metrics that matter, such as customer requirements, organizational goals, or critical performance indicators.
One of the key considerations when selecting measurement methods is their relevance to customer requirements, support of improvement and organizational goals, data accuracy, availability, and ease of data collection. This underscores the significance of aligning the measurements with what truly matters to your customers and your organization's strategic objectives. It's not just about gathering data for the sake of it; it's about capturing insights that can drive meaningful improvement. This attentiveness to relevancy separates effective measurement systems from superficial data collection exercises.
In addition to identifying important metrics, it's essential to understand the variation arising from the measurement system itself. This leads us to the concept of Measurement System Analysis (MSA), which assesses the accuracy, repeatability, reproducibility, and linearity of the measurement system. All these factors contribute to understanding how reliable our measurements are and if they are capturing true variability in our processes.
When it comes to variation, there are two primary sources to consider - actual process variation and variation from the measurement system. Both can significantly impact our understanding of how our processes are functioning and where improvements can be made. By delving deep into these variations, we uncover nuances that might be hidden from plain sight but can have a profound impact on our ability to enhance operational efficiency and product quality.
A real-world example of this would be examining customer satisfaction levels in a service industry using various data collection techniques like surveys, interviews, and customer feedback logs. Each method has its own strengths and weaknesses, with different degrees of impact on customer perceptions and insights that can guide targeted improvements.
The Measure Phase may seem like an elaborate exercise in data collection, but its significance cannot be overstated. It acts as a powerful diagnostic tool that uncovers critical areas for process improvement, armed with objective insights and clear visibility into process dynamics.
Transitioning from comprehending the intricacies of measurement to harnessing the power of collected data presents a compelling narrative that unfolds in the next section—the vital role played by data collection in enhancing process measurement.
Importance of Data Collection in Measure Phase
In the world of process improvement, data is akin to a treasure map, guiding organizations toward buried opportunities for enhancement by providing a clear picture of where to direct their efforts. The Measure Phase depends on gathering accurate, relevant, and reliable data to truly comprehend the current state of a process. By doing so, it sets the stage for identifying areas in need of improvements and scrutinizing the root causes behind performance issues.
Now, imagine embarking on a journey without a map or any knowledge of your surroundings. Attempting process improvements without adequate data would be akin to navigating unknown terrain blindly. Data serves as a guiding light, illuminating the operational excellence that can be achieved. Without it, decisions are mere estimations, and change efforts lack concrete direction.
Moreover, in an environment driven by evidence-based decision-making, data stands as the bedrock upon which strategies are built. It provides credibility to improvement initiatives, enabling stakeholders to advocate for change with solid numbers and trends rather than abstract assumptions.
To illustrate this further, think of data collection as assembling puzzle pieces. Each piece represents a different aspect of the process - its strengths, weaknesses, and potential bottlenecks. As more pieces are added (data collected), a clearer image of the overall situation emerges. This complete picture empowers organizations to pinpoint precise areas for improvement and create targeted solutions.
Consider an organization seeking to streamline its manufacturing process to reduce defects. Data collection would entail gathering information on defect rates, production times, machine downtime, and other relevant metrics. This comprehensive data would provide insights into specific stages of the process that require attention and aid in devising effective corrective measures.
As demonstrated, data collection serves as the compass that guides improvement endeavors in the Measure Phase. It is not just about accumulating numbers; rather, it is about leveraging these numbers to steer processes toward peak performance.

Measure Phase in Six Sigma DMAIC
Performance Measures and Their Selection
The Measure Phase in a Six Sigma process is vital, focusing on gathering information to understand how a process is performing. Choosing the right performance measures is crucial as they provide insight into the effectiveness and efficiency of the processes being analyzed. These measures act as the scales used to weigh progress and pinpoint areas needing improvement.
Defect Rates: One of the most crucial performance measures to consider is defect rates. This metric quantifies the number of errors or defects in the output of a process. Tracking and analyzing defect rates enables organizations to identify patterns, assess their impact on overall quality, and take proactive measures to reduce them.
For instance: A product manufacturing unit may measure defect rates to understand and minimize production errors, ultimately enhancing product quality and reducing rework costs.
Customer Satisfaction Scores
Another essential performance measure is customer satisfaction scores. These scores reflect how well a business meets customer expectations across various touchpoints, such as service delivery, product quality, and support.
Customer satisfaction scores are valuable indicators for service-oriented businesses like restaurants, where feedback from customers can directly impact operational improvements. A high score reflects positively on the business's performance, while a drop indicates potential areas for refinement.
It's important to note that while these performance measures are valuable, selecting them should align closely with customer requirements, organizational goals, and improvement efforts. Metrics such as cycle times for processes can help in understanding the time taken at each step, vital for identifying bottlenecks and inefficiencies.
Apart from these key performance indicators (KPIs), other factors like data accuracy, availability, ease of collection, and relevance to organizational objectives play a significant role in their selection. The chosen metrics should not only shed light on current process performance but also support future improvement initiatives.
The careful selection of performance measures acts as a compass guiding organizations towards targeted improvements in their processes. Now let's explore how these measures feed into the broader process improvement framework.
Techniques for Analyzing Data
When gathering data to understand process performance, it's time to put the data under the microscope and extract valuable insights. Several techniques used in Six Sigma effectively analyze data, each serving a unique purpose in revealing trends, patterns, and relationships within the collected data.
Control Charts
Control charts are one of the primary tools utilized in the Measure Phase of Six Sigma. Their purpose lies in monitoring process stability over time by plotting data points based on a specific measure. This allows for the identification of variations or abnormalities.
By showing upper and lower control limits, these charts determine whether a process is stable and predictable or exhibiting signs of variation requiring attention.
Process Mapping
Another vital technique used in Six Sigma is process mapping, which visually represents and analyzes a process from start to finish. It provides a comprehensive view of the steps involved, their interrelations, input-output dependencies, and potential areas for improvement. Through process mapping, it becomes possible to identify bottlenecks, redundancies, and inefficiencies for enhancement.
Cause-and-Effect Diagrams
Cause-and-effect diagrams, also known as fishbone diagrams or Ishikawa diagrams, serve as powerful analytical tools used to identify potential causes for a specific effect or problem. They help break down complex issues into more digestible components, making it easier to recognize contributing factors and their interrelationships.
In the context of the Measure Phase, cause-and-effect diagrams are instrumental in pinpointing potential sources of variation and deviations within the process.
Utilizing these analytical techniques enables organizations to gain a comprehensive understanding of their processes and identify opportunities for optimization, setting the stage for meaningful improvement initiatives as they progress through the Six Sigma methodology.
These techniques collectively contribute to uncovering actionable insights from data analysis, facilitating informed decision-making and targeted process improvements within the Measure Phase of Six Sigma.
Ensuring Measurement System Accuracy in Six Sigma
In Six Sigma, ensuring that the measurement system is accurate is like laying a strong, stable foundation for a building. If the foundation has flaws, the whole structure is compromised. The same goes for measurements in a process improvement project - if the data is not reliable, then any decisions or improvements made based on that data might not lead to the desired outcomes.
Measurement System Analysis (MSA) is a method used to evaluate the performance and dependability of a measurement system. It helps identify variations in the production process – something we don't want to miss because it can be indicative of larger problems down the line. MSA considers factors such as selecting the right approach and measurement, evaluating measuring devices, assessing operators and procedures, and evaluating measurement uncertainty.
Measurement System Analysis (MSA) Fundamentals
The basics of MSA involve determining the number of assessors and sample parts, ensuring assessors have knowledge of methods, selecting sample elements properly, and using proper measuring instruments with sufficient resolution/discrimination.
One key part of this analysis is the Gauge R&R Study, which is performed to assess the reliability of a measurement system. Imagine it like comparing measurements between different people using the same ruler–if they all get different lengths for the same object, you know there's something wrong and you need to figure out what that is. In other words, it helps us understand how much our measurement system varies.
For instance, let's say we're manufacturing computer casings. We would perform a Gauge R&R Study by having multiple operators measure sample sheet metal casings with varying characteristics. We then compare these measurements to see if there are differences among the operators. This can help us uncover whether there are issues with variability in measurements or if certain operators consistently produce different results.
By conducting this type of thorough analysis, we're able to make better data-driven decisions. It allows us to spot small changes in the process that may seem insignificant but could be indicative of larger underlying issues. Ultimately, it ensures the validity of conclusions based on data by making sure that our measurements are reliable and not influenced by external factors.
Now that we've laid out why ensuring accuracy in our measurement system is crucial, let's delve into some common tools and techniques used in MSA to achieve this.

Measure Phase in Six Sigma DMAIC - Measurement Systems
Actions and Results Verification in Measure Phase
Once data has been collected, it's essential to thoroughly verify the validity and reliability of the information obtained. This verification process encompasses several crucial components that ensure the integrity of the analysis and subsequent improvement efforts. Let's break down these components to gain a comprehensive understanding of this critical phase.
First and foremost, it's imperative to review the data collection process itself. This involves assessing the methods used to gather information, ensuring that they align with established best practices and effectively capture essential process elements. By conducting a rigorous evaluation of the data collection methods, potential biases or inaccuracies can be identified and rectified early on, bolstering the credibility of the subsequent analysis.
In addition to scrutinizing the data collection methods, it is equally essential to evaluate the chosen metrics against the process performance. The selected metrics should directly reflect the critical aspects of the process under examination, enabling an accurate assessment of its performance and facilitating informed decision-making. By confirming the alignment between chosen metrics and process intricacies, organizations can confidently proceed with implementing targeted improvements based on substantiated evidence.
Another pivotal aspect of actions and results verification in the Measure Phase is ensuring that areas earmarked for improvement are supported by empirical evidence. This entails a meticulous examination of the data to pinpoint performance shortcomings and areas ripe for enhancement. By corroborating observed deficiencies with concrete data, organizations can confidently prioritize improvement initiatives, knowing that their decisions are rooted in factual insights rather than assumptions.
Moreover, this verification encompasses a comprehensive validation of all findings against established benchmarks and industry standards. The data must withstand scrutiny against established norms, ensuring that any identified variances from expected performance levels are grounded in robust evidence. By subjecting findings to such scrutiny, organizations safeguard against unwarranted conclusions and lay a solid foundation for subsequent improvement endeavors.
By closely scrutinizing each facet of data collection and analysis, organizations can instill confidence in their findings and bolster the effectiveness of their improvement initiatives. It is through this rigorous verification process that organizations pave the way for targeted, impactful interventions that drive substantive enhancements in operational efficiency and overall performance.
Ensuring the accuracy and reliability of data is foundational in achieving successful process improvements. Through meticulous verification, organizations can make informed decisions that lead to tangible enhancements across their operations.
Frequently Asked Questions for Measure Phase in Six Sigma
What are some common challenges faced during the measure phase?
Answer: Some common challenges faced during the measure phase in Six Sigma include data collection errors, lack of clarity in defining metrics, and difficulty in establishing a baseline for process performance. These challenges can lead to inaccurate analysis and flawed decision-making. According to a study by the International Six Sigma Institute, 42% of organizations reported facing challenges related to collecting accurate and reliable data during the measure phase, highlighting the significance of this issue.
What are the main objectives of the measure phase in Six Sigma?
Answer: The main objectives of the Measure phase in Six Sigma are to identify and define key process metrics, gather accurate data, and establish a baseline for current process performance. This phase focuses on understanding the process and quantifying its variation to enable effective problem-solving. By collecting reliable data, teams can evaluate process capability and efficiency, leading to informed decision-making. According to a study conducted by International Six Sigma Institute, organizations implementing Six Sigma experienced an average improvement of 35% in process performance after completing the Measure phase.
Are there any best practices or tips for effectively executing the measure phase in Six Sigma projects?
Answer: Yes, there are several best practices and tips for effectively executing the measure phase in Six Sigma projects. Firstly, it is crucial to establish clear project goals and identify key process metrics before collecting data. It is also important to gather sufficient and representative data to ensure accurate analysis and decision-making. Additionally, utilizing statistical tools such as control charts, histograms, and process capability analysis can help assess the current process performance effectively. According to recent studies, organizations that follow these best practices during the measure phase have achieved a significant improvement in process efficiency, with a 25% reduction in defects and a 20% increase in customer satisfaction.
How does the measure phase contribute to process improvement in Six Sigma?
Answer: The measure phase is a crucial step in Six Sigma process improvement as it focuses on gathering data and measuring the current state of a process. By collecting accurate and reliable measurements, Six Sigma practitioners can identify process bottlenecks, inefficiencies, and variations that impact quality and customer satisfaction. This phase allows for a deeper understanding of the process performance through tools like data collection plans, process mapping, and statistical analysis. Statistics such as process capability indices and defect rates provide objective insights into the process's current performance, highlighting areas for improvement. Ultimately, the measure phase sets the foundation for targeted improvements in subsequent phases of Define, Analyze, Improve, and Control (DMAIC).
What are the key tools and techniques used in the measure phase?
Answer: In the Measure phase of Six Sigma, important tools and techniques used include process mapping, data collection, measurement system analysis (MSA), and statistical analysis. Process mapping helps to visually represent the current state of the process, identifying areas of improvement. Data collection allows for gathering relevant information about the process performance. MSA ensures that the measurement system is reliable and accurate. Statistical analysis aids in analyzing collected data to identify trends, patterns, and potential sources of variation. According to a study conducted on Six Sigma implementation in manufacturing, utilizing these tools resulted in a significant reduction in defects by an average of 70% (source: Journal of Manufacturing Technology Management).
Variation between appraiser is also known as ...
Answer: Variation between appraisers is also known as "appraiser variation" in the Measure phase of Six Sigma's DMAIC methodology. To address this issue, it is crucial to establish a comprehensive data collection plan within the measurement systems analysis (MSA) to quantify the amount of variability introduced by different appraisers. Identifying the root cause of appraiser variation is essential for enhancing the reliability of measurements and ensuring consistent data across the Six Sigma process.
In which phase of the Six Sigma, the sources of variation are identified?
Answer: In the Measure phase of the Six Sigma DMAIC (Define, Measure, Analyze, Improve, Control) methodology, the team focuses on identifying and understanding the sources of variation in the process. By thoroughly analyzing inputs, resources, and employing tools such as Failure Mode and Effects Analysis (FMEA) and process maps, the team can effectively pinpoint and quantify the factors contributing to variability, laying the foundation for data-driven decision-making and improvement initiatives in subsequent phases.
Sigma is a measure of ...
Answer: Sigma is a measure of the variability in a process, reflecting its capability and performance. In the Measure phase of Six Sigma's DMAIC methodology, establishing a robust measurement system is crucial. This involves creating a process map to understand the key steps and variables, ensuring proper documentation of measurement procedures, and placing emphasis on accuracy and consistency to enhance the overall effectiveness of the improvement initiative.
What is 6 sigma probability?
Answer: In Six Sigma methodology, sigma level is a measure of process capability, indicating the standard deviation of a process's performance relative to its specifications. The sigma level corresponds to a specific probability of defects occurring, with higher sigma levels indicating a lower probability. In DMAIC (Define, Measure, Analyze, Improve, Control) activities, the Measure phase involves assessing the current sigma level of a process through statistical analysis and measurement systems evaluation, providing a baseline for subsequent root cause analysis to identify and address factors contributing to deviations from desired outcomes.
In DMAIC how the measurement focus varies in measure and control?
Answer: In the Measure phase of DMAIC (Define, Measure, Analyze, Improve, Control) in Six Sigma, the primary focus is on establishing robust measurement systems to accurately capture Critical-to-Quality (CTQ) parameters. The emphasis lies in identifying and validating key metrics essential to meeting customer requirements. As the project progresses into the Control phase, the measurement systems implemented during the Measure phase play a pivotal role in ensuring sustained process improvement, enabling continuous monitoring and control of CTQs to maintain the desired quality standards.
Plot processing times by using ...
Answer: In the Measure phase of Six Sigma's DMAIC methodology, it is crucial to begin with a clear problem statement and an understanding of the current state of processes. Utilizing a value stream map helps identify inefficiencies and areas for improvement. As part of the measurement systems analysis, practitioners should plot processing times using appropriate statistical tools, ensuring accuracy and reliability in the data collected. For a comprehensive approach, incorporating training courses on measurement system definitions is essential to establish a common language and enhance precision in measurements, laying a solid foundation for effective problem-solving within the Lean Six Sigma framework.
Data in a time-ordered sequence will not be in measurements of?
Answer: In the Measure phase of Six Sigma's DMAIC methodology, the focus is on establishing robust measurement systems to ensure accurate and reliable data. Team members must place emphasis on understanding the time-ordered sequence of data, recognizing that without proper expertise in measurement systems, the information may not be in meaningful units or lack the necessary precision for effective analysis. Therefore, team members need to bring their expertise to bear in designing measurement systems that align with the specific characteristics and requirements of the data in question.
Variations six sigma?
Answer: In the Measure phase of Six Sigma's DMAIC methodology, a crucial aspect revolves around understanding and addressing variations. Variations, inherent in any process, necessitate a robust measurement system to accurately capture and quantify them. Therefore, the work in this phase focuses on establishing measurement systems that meet the precision and reliability needs essential for effective process analysis and improvement.
What MSA Six Sigma?
Answer: Measurement System Analysis (MSA) in Six Sigma refers to a critical aspect of the Measure phase in the DMAIC methodology. A black belt practitioner employs MSA to evaluate the reliability and precision of measurement systems used to collect data during process improvement. This meticulous examination ensures that the data obtained from the measurement systems, as outlined in the SIPOC (Supplier, Input, Process, Output, Customer) diagram, is accurate and consistent, forming a solid foundation for informed decision-making in the pursuit of operational excellence.
In which phase of the six sigma the sources of variation are identified?
Answer: During the Measure phase in Six Sigma's DMAIC methodology, the primary focus is on identifying and quantifying sources of variation within a process. This involves meticulous measurement systems analysis to assess the reliability and precision of data collection methods. By scrutinizing inputs such as materials, suppliers, and project management practices, this phase aims to uncover the key variables contributing to variations, ultimately paving the way for targeted improvements that enhance overall process performance and yield benefits for the organization.
Recap for Measure Phase in Six Sigma
In summary, the Measure phase in Six Sigma serves as a critical stage in the DMAIC methodology, where a meticulous analysis of processes takes place to identify and quantify sources of variation. This involves scrutinizing key inputs such as materials, suppliers, and project management practices, ultimately leading to a comprehensive understanding of the factors influencing process performance. By honing in on these variables, companies can strategically target areas for improvement, fostering a data-driven approach to decision-making.
Successful implementation of the Measure phase has been demonstrated by numerous companies across various industries. Through careful measurement systems analysis and identification of variation sources, organizations have enhanced the quality of their products and services, leading to increased customer satisfaction and loyalty. Moreover, the insights gained from this phase have proven instrumental in optimizing supply chain operations, streamlining processes, and gaining a competitive edge in the market.
As you embark on your Six Sigma journey, consider delving deeper into the methodology's frameworks and applications.
The International Six Sigma Institute offers a free Six Sigma Framework book, providing valuable insights into the ways Six Sigma can be applied to drive success in company development. To learn more and access this valuable resource, visit
https://www.sixsigma-institute.org/FreeSixSigmaBook.
 SIXSIGMA INSTITUTE™


