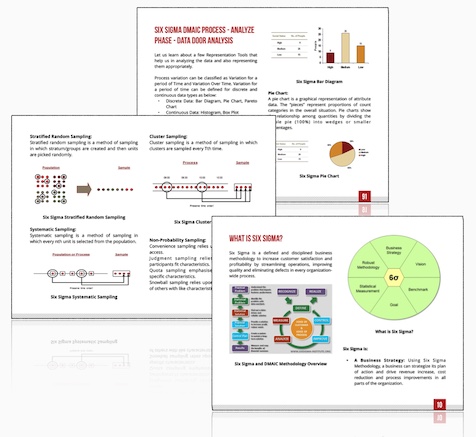
Six Sigma DMAIC Process - Analyze Phase - Analysis Examples
1-sample t-Test Example:
Definition: A hypothesis test for comparing a population mean against a given standard for any significant differences.
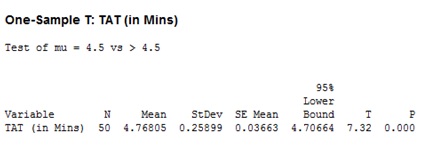
Situation: You have 50 data points on the TAT for your process and you want to check if the mean of your TAT is worse than your competitors TAT of 4.5 minutes.
Null: Mean TAT <= 4.5 minutes
Alternate: Mean TAT > 4.5 minutes
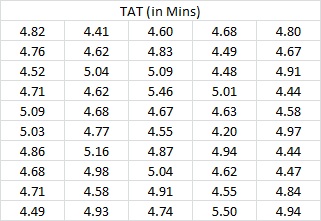
Turn Around Time (in Mins)
Analysis Result
Result: A One-Sample t-test helps us compare the mean of the sample to that of one value. In our example, we wanted to identify if our TAT is better or worse than 4.5. Using the results of the session window described above, we observe that the P-value is less than 0.05 which indicates that we reject the null hypothesis. Thus, our performance is worse than our competitors performance.
2-sample t-Test Example:
Definition: A hypothesis test for comparing means of two different populations for any significant differences.
Situation: You have two shifts in your process, morning shift & evening shift and you want to find out if there is a significant difference in the average in TAT of morning shift and night shift.
Null: Mean of (Morning shift = Evening shift)
Alternate: Mean of (Morning shift != Evening shift)
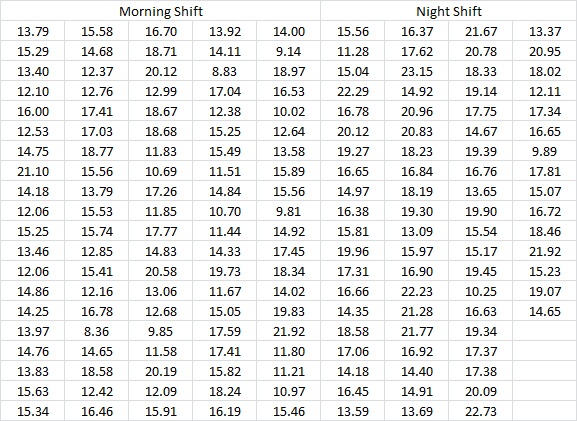
Morning Shift and Night Shift Data
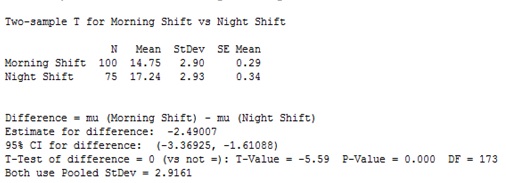
Analysis Result
Result: A Two-Sample t-test helps us compare the mean of two samples. In our example, we wanted to identify if morning shift performance is equal to evening shift performance. Using the results of the session window described above, we observe that the P-value is less than 0.05 which indicates that we reject the null hypothesis. Thus, performance of morning shift is not equal to evening shift.
One-Way ANOVA Example:
Definition: A hypothesis test for comparing the means of more than two populations for any significant differences.
Situation: You want to see if there is a significant difference in the average TAT of your staff A, B, C, D.
Null: Mean of (Staff A = Staff B = Staff C = Staff D)
Alternate: Mean of (Staff A != Staff B != Staff C != Staff D)
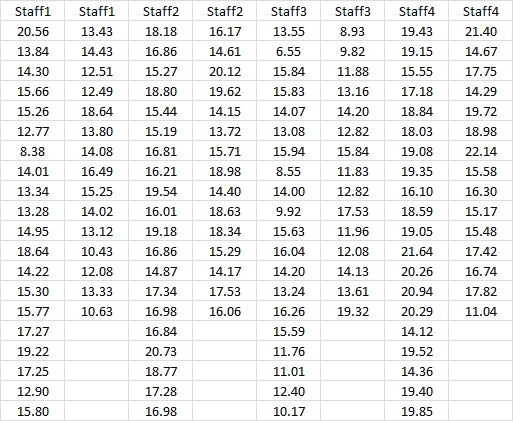
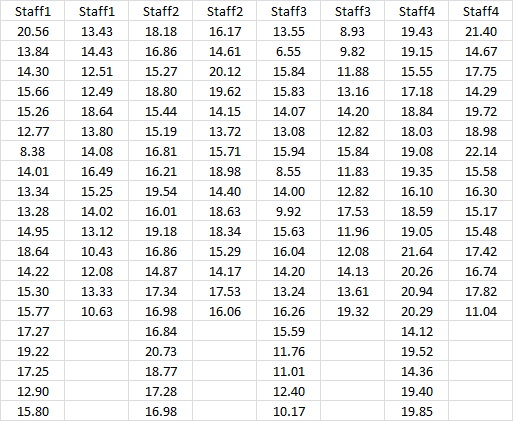
Staff 1, Staff 2, Staff 3 and Staff 4 Data
Analysis Result
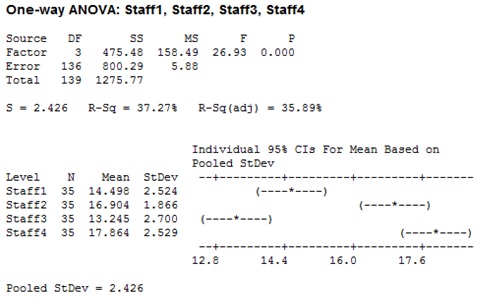
Result: A One-Way ANOVA helps us compare the mean of more than two samples. In our example, we wanted to check if the performance of the four staff is same or different. Using the results of the session window described above, we observe that the P-value is less than 0.05 which indicates that we reject the null hypothesis. Thus, performance of Staff 1 != Staff 2 != Staff 3 != Staff 4.
Mood's Median Test Example:
Definition: A hypothesis test for comparing the medians of two or more than two populations for any significant differences.
Situation: You want to see if there is a significant difference in the TAT of your staff A, B, C, D.
Null: Median of (Staff A = Staff B = Staff C = Staff D)
Alternate: Median of (Staff A != Staff B != Staff C != Staff D)
Staff 1, Staff 2, Staff 3 and Staff 4 Data
Analysis Result
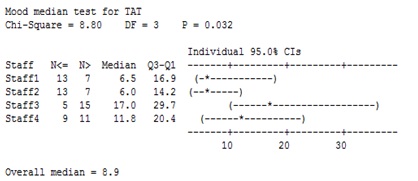
Result: A Mood’s Median Test helps us compare the medians of more than two samples. In our example, we wanted to check if the median performance of the four staff is same or different. Using the results of the session window described above, we observe that the P-value is less than 0.05 which indicates that we reject the null hypothesis. Thus, median performance of Staff 1 != Staff 2 != Staff 3 != Staff 4.
Chi-SquareTest Example:
Definition: A hypothesis test for comparing output counts from two or more sub-groups for any significant differences.
Situation: You want to see if one set of defectives data is significantly different from another set of defectives data.
Null: No difference in the two sub-groups
Alternate: Difference exists in the two sub-groups

Data for Chi-Square Test
Analysis Result
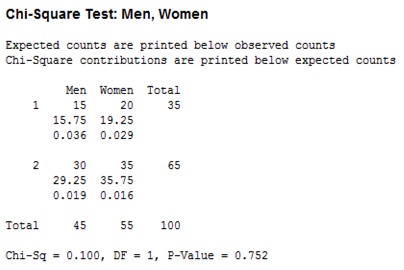
Result: A Chi-Square Test helps us compare the count data. In our example, we wanted to check if one set of defectives data is significantly different from another set of defectives data. Using the results of the session window described above, we observe that the P-value is greater than 0.05 which indicates that we fail to reject the null hypothesis. Thus, No difference in the two sub-groups.
 SIXSIGMA INSTITUTE™


